

- Protest pictures on Flickr correlate with news reports of protests
- Research could provide useful updates of worldwide protests happening
- 25 million photos on Flickr anaylsyed for study
- Study mapped protests across the world in 2013
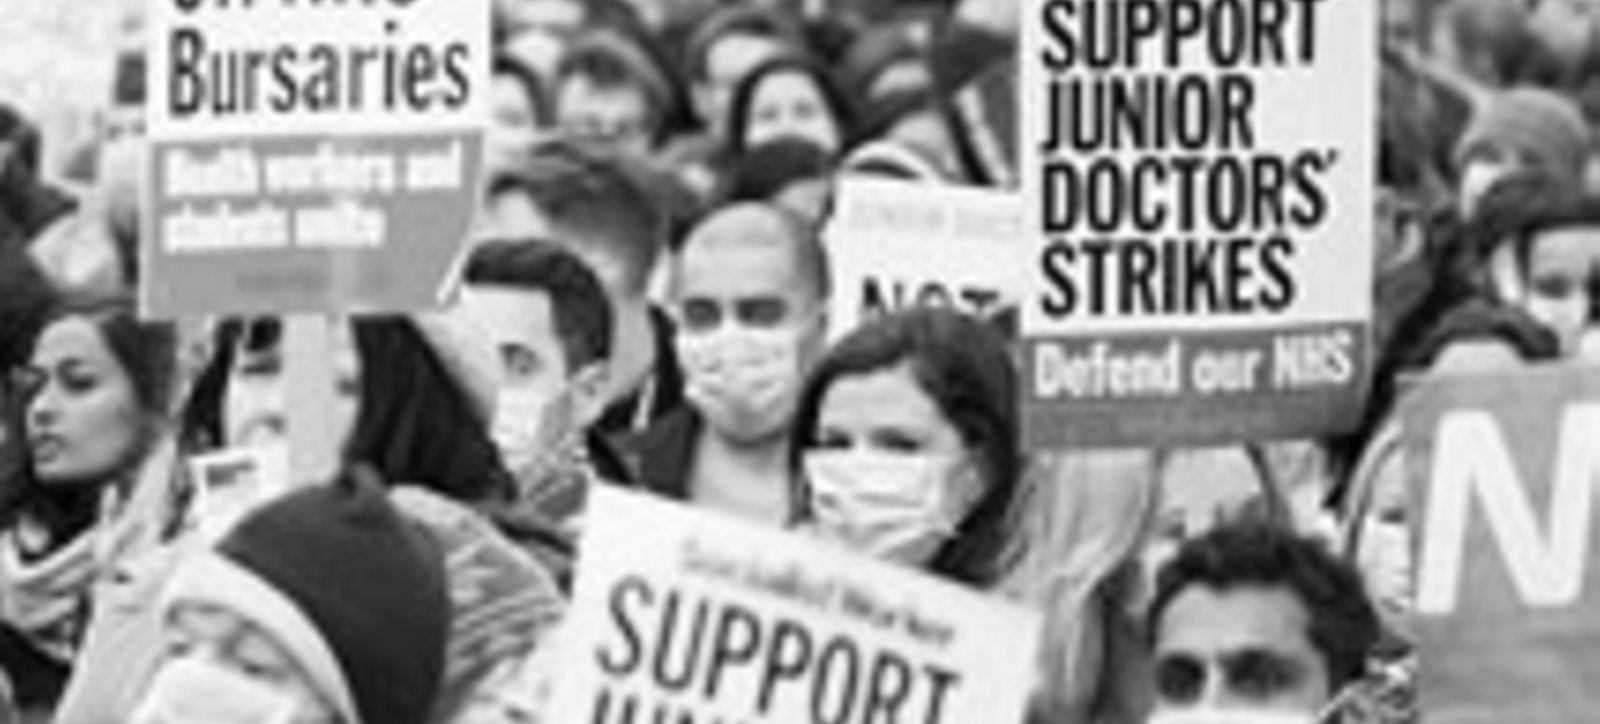
Analysis of millions of photographs on Flickr has found that protests can be mapped across the world as they happen.
Merve Alanyali, Tobias Preis and Suzy Moat, of the Data Science Lab at Warwick Business School, analysed data on 25 million photos taken and uploaded to Flickr in 2013 across 244 countries and regions to produce a map of the world’s protests over the year.
Related article: More mentions in FT linked to greater popularity of stocks
In Tracking Protests Using Geotagged Flickr Photographs published in PLOS ONE the team found that in weeks in which higher proportions of ‘protest’ labelled photographs were detected in a given country or region, the newspaper The Guardian also published a greater proportion of ‘protest’ labelled news reports relating to that country or region.
Alanyali, a PhD candidate in the Data Science Lab, part of Warwick Business School’s Behavioural Science Group, said: “Recent years have witnessed waves of protests sweeping across countries and continents, in some cases resulting in political and governmental change.
Related course: MSc Business Analytics
“Much media attention has focused on the increasing usage of social media to co-ordinate protests and provide instantly available information on these events.
“In light of these reports, we began to investigate whether it is possible to identify protest outbreaks through quantitative analysis of activity on Flickr.”
.jpg)
Dr Preis, Associate Professor of Behavioural Science and Finance, added: “For each country and region, we identified photographs taken and uploaded to Flickr in each week of 2013, and determined what proportion of these photographs was labelled with the word ‘protest’ either in the photograph title, description or text. We considered both the word ‘protest’ in English, and translations of the word in 33 other languages.”
As an estimate of the actual prevalence of protests in each country or region, the team considered data from the newspaper The Guardian. For each week in 2013, they determined what proportion of news articles about a country or region were labelled with the word ‘protest’.
Dr Moat, Associate Professor of Behavioural Science, said: “We found that greater proportions of ‘protest’ labelled Flickr photographs taken at a given location in a given week corresponded to greater proportions of ‘protest’ labelled news reports about that country or region in The Guardian.”
Alanyali added: “Our analysis suggests that data on photographs uploaded to Flickr may contain signs of protest events. Our findings underline the potential value of photographs posted on the internet as a source of global, cheap and rapidly available measurements of human behaviour around the world.”
Learn more about big data on our free online course Big Data: Measuring and Predicting Human Behaviour
 X
X Facebook
 LinkedIn
 YouTube
 Instagram
 Tiktok